The Boxes — Imbalance / Fair Value Gap Zones
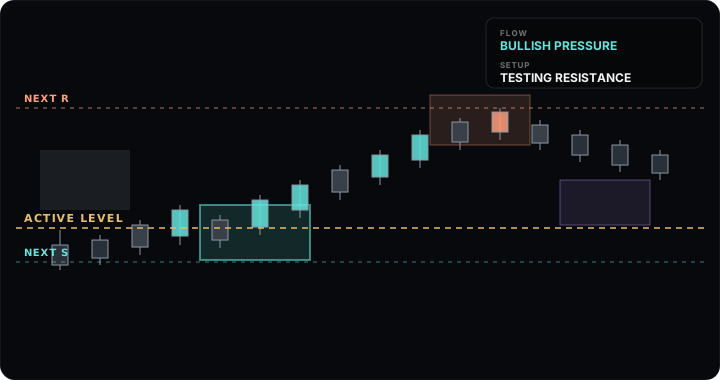
Places where price moved through an area quickly without much two-way trading — often a magnet or a reaction zone if price returns to them later.
- Teal boxes — bullish zones (support-side imbalance)
- Orange boxes — bearish zones (resistance-side imbalance)
- Gray boxes — quiet / neutral zones, lower conviction
- Purple boxes — inverse zones, a zone that's flipped role after being broken through
Thicker-outlined boxes are "strong" zones — either the move was on above-average volume, or the candle body was unusually large. Volume and body size are the two ways the Map judges a zone worth more attention.
The Lines — Active Level & Structure
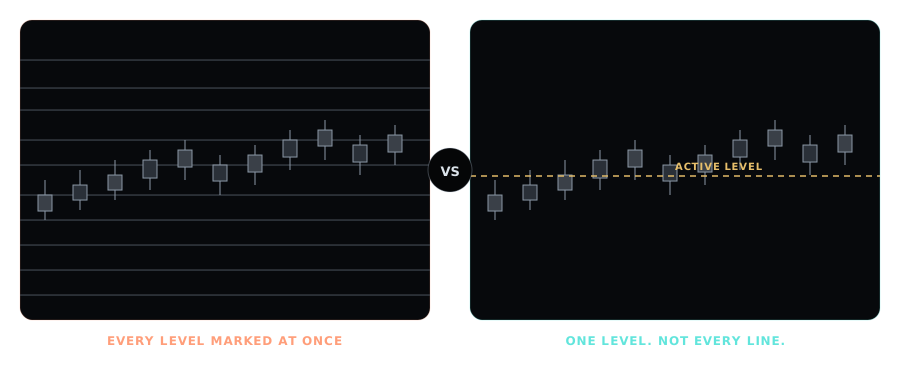
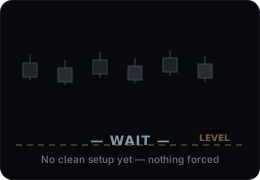
- Active Level (gold) — the one level currently being watched, and the anchor for every setup call. Turns teal once price closes above it.
- Next R — the nearest confirmed resistance above price. Also turns teal once reclaimed.
- Next S — the nearest confirmed support below price.
- Prior S / Prior R — secondary context from prior sessions, shown lighter so it doesn't compete with the live levels.
Session high/low and a live price line with stop-guide lines (a set point distance from current price) round out the structure — useful for placing a manual stop when a broker's bracket-order automation isn't available, such as during copy-traded execution across linked accounts.
The Labels — FLOW & SETUP
FLOW is the short-term trend read, blending a fast and a slower window of price action:
BULLISHBEARISHBULLISH PRESSUREBEARISH PRESSUREMIXED
"Pressure" means the same direction, but with urgency — the move has cleared a distance threshold with real conviction and, in the current version, above-average volume behind it. MIXED is the default whenever the two windows disagree or price is too choppy to trust.
SETUP is whether the Active Level is producing an actual, confirmed signal right now — checked in order of strength, only one shown at a time:
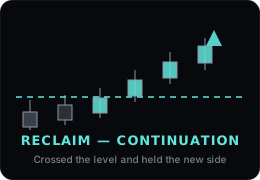
- Reclaim / Breakdown — Continuation — price just crossed the level and held the new side. The strongest, most decisive read.
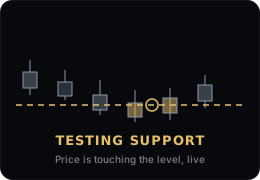
- Testing Support / Resistance — price is touching the level right now, live.
- Hold / Rejection — Potential — a completed candle just defended the level and closed away from it on real volume.
- Extended Up / Down — Pressure — price has moved a meaningful distance from the level and fresh momentum is still pushing the same way.
- Reclaim / Breakdown (Structural) — a slower-forming version of the same idea, for a cross that happened a little while ago.
- Approaching Support / Resistance — price is getting close with real momentum toward it, but hasn't reached it yet. An early heads-up, not a signal to act on.
- Wait — No Clean Setup — nothing has lined up yet. This is also what you'll see through a large move if price simply hasn't reached the tracked level — expected, not a glitch.
BAR reads three numbers left to right — PREV (the prior candle's range), LIVE (the current candle's range so far), and MOVE (the current candle's net direction, signed, updating every tick). TIME is a color-coded countdown to the current candle's close.